Monday, June 9, 2014

EIA Analyzes Power Sector Emissions Factors

graph of AEO2014 projections of energy-related CO2 emissions in five cases, as explained in the article text
Source: U.S. Energy Information Administration, Monthly Energy Review, September 2013, and the Annual Energy Outlook 2014
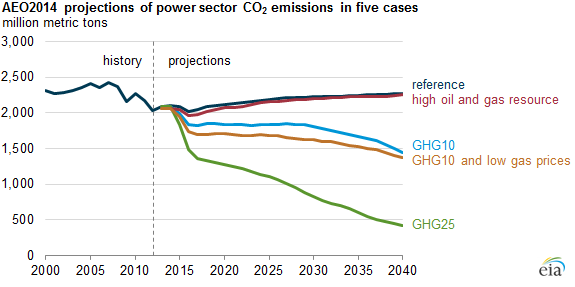
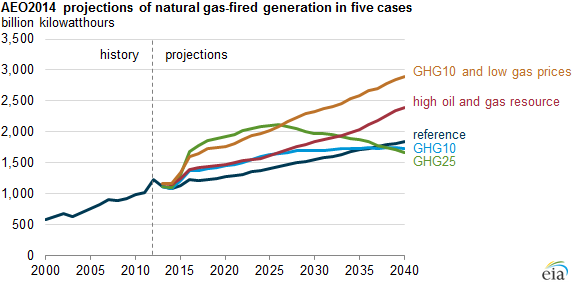
Note: GHG is greenhouse gases. The GHG10 case assumes a $10 per metric ton fee on CO2 emissions, beginning in the year 2015. The GHG25 assumes a $25 per metric ton fee on CO2 emissions beginning in 2015. Both cases escalate the CO2 fee at a rate of 5% per year. The GHG10 case with low natural gas prices combines the assumptions of the GHG10 case with the High Oil and Gas Resource case, which results in lower gas prices and encourages greater natural gas use.

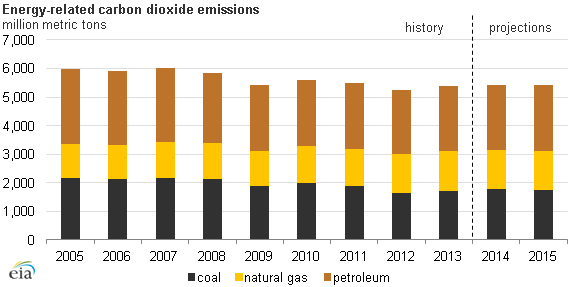
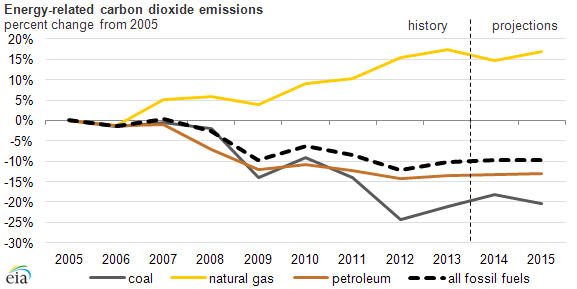
In 2012, almost 40% of total energy-related CO2 emissions resulted from electricity generation. About three-fourths of those power sector emissions occurred from burning coal, the most carbon-intensive fuel. Policies to reduce CO2 emissions could result in less consumption of coal in favor of natural gas, which emits about 40% as much CO2 per kilowatthour as typical coal-fired generation when used in a combined-cycle plant, as well as increases in other low- or zero-carbon power generating technologies such as renewables and nuclear.
Earlier this week, the Environmental Protection Agency (EPA) issued a proposed rule  that would require reductions in CO2 emissions from existing fossil-fueled electric power plants. The EPA proposal includes emission rate targets for each state, measured as pounds of CO2 emissions per megawatthour of covered generation, as well as guidelines for the development, submission, and implementation of state plans. The emission rate targets vary significantly across individual states, reflecting the application of a series of common building blocks to states with widely different starting points in their respective electricity markets.
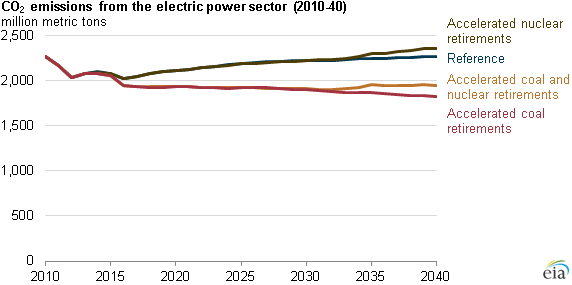
The Annual Energy Outlook 2014 (AEO2014) Reference case, which assumes current laws and regulations, does not include the EPA proposal. Currently there are two regional programs in the Northeast and California (the Regional Greenhouse Gas Initiative and Assembly Bill 32, known as RGGI and AB32, respectively) that include control policies for greenhouse gases (GHGs) from the power industry, which are also included in the AEO2014 Reference case. All existing final environmental rules, including the Mercury and Air Toxics Standard, are also included in the projections. After taking these existing environmental regulations into account, the projections for electricity generation and its resulting emissions are primarily determined by the relative operating costs of the different technologies. The AEO2014 Reference case projections show several CO2-related trends, including:
  • CO2 emissions from the electric power sector increase from 2,035 million metric tons in 2012 to 2,271 million metric tons in 2040, an increase of 12%
  • The share of power sector CO2 emissions from natural gas increases from 24% to 27%, as natural gas-fired plants account for most of the capacity that is added to meet increases in demand and to replace retiring plants
  • Few new coal plants are added, as uncertainty about future carbon regulations influences capacity decisions
While EIA does not assume the final structure of any proposed regulations, in order to represent policies that explicitly or implicitly place a value on GHG emissions, the AEO2014 includes alternative cases that impose a fee on energy-related CO2 emissions. These side cases incorporate an initial CO2 value of $10 (GHG10 case) and $25 (GHG25 case) per metric ton in 2015, rising by 5% per year. The GHG10 case is also combined with High Oil and Gas Resources, which results in lower gas prices and encourages greater natural gas use. In these side cases, EIA projects the following results as compared with the AEO2014 Reference case:
  • 2025 power sector CO2 emissions are 16% and 49% lower in the GHG10 and GHG25 cases with fees, respectively, and 23% lower when the GHG10 case is combined with the High Oil and Gas Resource case
  • 2040 power sector CO2 emissions reductions range from 36% to 82% across the three side cases, which is greater than the corresponding changes in other sectors and indicates that the electric power industry is typically the most cost effective sector to achieve reductions in response to economy-wide CO2fees
  • Natural gas-fired generation increases sharply beginning when CO2 fees are assumed to be introduced in 2015, followed by more nuclear and renewable plant additions as the fees increase
  • Natural gas-fired generation levels off around 2030 in the GHG10 case, and it begins to decline after 2025 in the GHG25 case
  • In the High Oil and Gas Resource case without CO2 fees, lower natural gas prices result in higher gas-fired generation and CO2 emissions in the power sector as more new natural gas plants are built instead of nuclear and renewable capacity
  • Natural gas-fired generation continues to increase through 2040 when the fees for the GHG10 case are combined with the lower gas prices from the High Oil and Gas Resource case
graph of AEO2014 projections of natural gas-fired generation in five cases, as explained in the article text
Source: U.S. Energy Information Administration, Monthly Energy Review, September 2013, and the Annual Energy Outlook 2014

Additional analysis can be found in the AEO2014 Market Trends discussion of emissions from energy use.

EIA Updates U.S. Emissions Trends

graph of U.S. energy-related CO2 emissions, as explained in the article text
Source: U.S. Energy Information Administration, State Energy Data System (SEDS) 2014

U.S. energy-related carbon dioxide (CO2) emissions in 2013 were 10% below the benchmark year of 2005. Emissions in 2013 were roughly 2% above their 2012 level and 1.5% below their 2011 level, when emissions were 8.6% below the 2005 level. Recently released state-level data through 2011, calculated from the State Energy Data System (SEDS) and aggregated here by Census regions, show different parts of the country generally experiencing this downward trend, but at variable rates by region.
Between 2005 and 2011, all four Census regions—West, South, Midwest, and Northeast—experienced emissions declines, with the Northeast experiencing larger emissions reductions than the other regions. Underlying state-level emissions changes spanned an even wider range, from a 20% emissions increase in Nebraska (Midwest) to a 33% decrease in Nevada (West). Regional and subregional spreads reflect differences in local energy economics, population distribution, and other factors.
graph of U.S. energy-related CO2 emissions, as explained in the article text
Source: U.S. Energy Information Administration, State Energy Data System (SEDS) 2014

Drivers of faster, larger emissions declines in the Northeast include extensive urbanization, translating into denser, more energy-efficient population centers, and increasingly low-carbon electricity generation from natural gas, nuclear, and renewables, instead of coal. The Northeast includes the top-three lowest emitting states per unit of economic output (New York, Connecticut, and Massachusetts) and two of the top-five states with the cleanest electricity sources (Vermont and New Hampshire).
Compared to the Northeast, the other regions (Midwest, West, and South) have more diverse state-level characteristics, which contributed to relatively slower net emissions declines. Steep emissions reductions in some states were partially offset by escalating emissions elsewhere. For example, states like Wyoming (West), North Dakota (Midwest), and West Virginia (South) have more carbon-intensive energy production, higher and less efficient energy use in more sparsely populated areas, and heavily coal-reliant electricity generation compared to other states in those regions. Since 2009, factors driving the uptick in Nebraska's emissions profile included marked expansion of the biofuels (corn-based ethanol) industry, as well as increased production of crude oil and the temporary closure of the Fort Calhoun nuclear power plant. Conversely, Nevada's lower-bounding trend shows the effects of substantially decarbonizing its electric power sector—between 2005 and 2011, Nevada significantly reduced its coal use, while increasing solar and geothermal use.
Earlier this week, the Environmental Protection Agency (EPA) issued a proposed rule that would require reductions in carbon dioxide emissions from existing fossil-fueled electric power plants. The EPA proposal includes emission rate targets for each state, measured as pounds of carbon dioxide emissions per megawatthour of covered generation, as well as guidelines for the development, submission, and implementation of state plans. The emission rate targets vary significantly across individual states, reflecting the application of a series of common building blocks to states with widely different starting points in their respective electricity markets.

Source: EIA

Monday, April 28, 2014

Effect of Power Plant Closures on CO2 Emissions

graph of CO2 emissions from the electric power sector, as explained in the article text


Source: U.S. Energy Information Administration, Annual Energy Outlook 2014, Issues in Focus

Significant retirements of nuclear and coal power plants in the United States could change the amount of carbon dioxide (CO2) emitted by the electric power sector. EIA's Annual Energy Outlook 2014 (AEO2014) features several accelerated retirements cases that represent conditions leading to additional coal and nuclear plant retirements in order to examine the potential energy market and emissions effects of the loss of this capacity. CO2 emissions are significantly reduced when compared to the Reference case in side cases with accelerated coal retirements. CO2 emissions increase slightly in the Accelerated Nuclear Retirements case. Natural gas and renewables are the primary replacements for lost capacity in each scenario.

Source: EIA

Monday, January 13, 2014

EIA Releases 2013 U.S. CO2 Emissions Estimate

graph of energy-related carbon dioxide emissions, as explained in the article text


Source: U.S. Energy Information Administration, Short-Term Energy Outlook, January 2014

Once all data are in, energy-related carbon dioxide (CO2) emissions in 2013 are expected to be roughly 2% above the 2012 level, largely because of a small increase in coal consumption in the electric power sector. Coal has regained some market share from natural gas since a low in April 2012; however the impact on overall emissions trends remains fairly small.
Emissions in 2013 are slightly more than 10% below 2005 levels, a significant contribution towards the goal of a 17% reduction in emissions from the 2005 level by 2020 that was adopted by the current Administration. This level of reduction is expected to continue through 2015, according to EIA's most recent Short-Term Energy Outlook.

graph of energy-related carbon dioxide emission, as explained in the article text


Source: U.S. Energy Information Administration, Short-Term Energy Outlook, January 2014

CO2 emissions from energy activities declined four out of six years since their 2007 peak, and were historically low (12% below the 2005 level) in 2012. From 2005 to 2013, the key energy-economic drivers of a changing U.S. energy landscape included:

  • Weak economic growth in recent years, dampening growth in energy demand compared to pre-recession expectations
  • Continuously improving energy efficiency across the economy, including buildings and transportation
  • High energy prices over the past four years, with the exception of natural gas, since about 2010
  • An abundant and inexpensive supply of natural gas, resulting from the widespread use of new production technologies for shale gas
  • Power sector decarbonization since 2010, as natural gas and renewables displaced coal
Source: EIA